favstats()
The favstats() function will compute a set of common summary statistics ("favorite stats") for a given variable, including the five-number summary (minimum, Q1, median/Q2, Q3, maximum), the mean, the standard deviation, the sample size (n), and the number of missing cases.
For more information on how the favstats() function computes the five-number summary, see this article:
 Example 1:
Example 1:
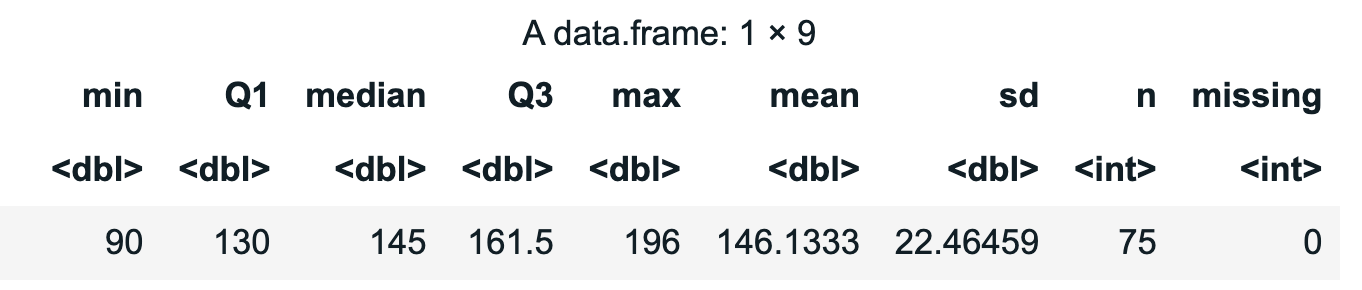
# Compute the favstats() for Thumb
favstats(~Thumb, data = Fingers)
Example output:
Example 2:
Example 2:
# Compute the favstats() for Thumb by Gender
favstats(Thumb ~ Gender, data = Fingers)
Example output:

Related Articles
gf_dist()
The gf_dist() function can graphically overlay a number of different mathematical probability distributions. If we want to overlay the normal distribution, we’ll have to specify that with the argument “norm”, and then enter in the mean and standard ...gf_vline()
The gf_vline() function will add a vertical line onto a plot. You can plot the line by referencing a value in a data frame (Example 1), or by specifying the point along the axis where the line should run through (Example 2). Example 1: # Save the ...Five-Number Summary
The five-number summary is a handy way to describe the spread of a distribution around its median. To calculate the five-number summary, we first sort the data points from smallest to largest along the scale on which the variable is measured. Next we ...xpnorm()
The xpnorm() function will generate the probability and z-score for a value (X) based on the mathematical function for a normal distribution. It can do this with just three pieces of information: the border you are interested in, and the mean and ...Vectors
Vectors Vectors are one of the most basic and important data structures in R. A vector is an ordered collection of values of the same data type, such as numbers, characters, or logical (TRUE/FALSE) values. In statistics and data science, vectors are ...