xpnorm()
The xpnorm() function will generate the probability and z-score for a value (X) based on the mathematical function for a normal distribution. It can do this with just three pieces of information: the border you are interested in, and the mean and standard deviation of the normal distribution.
 Example:

Example:
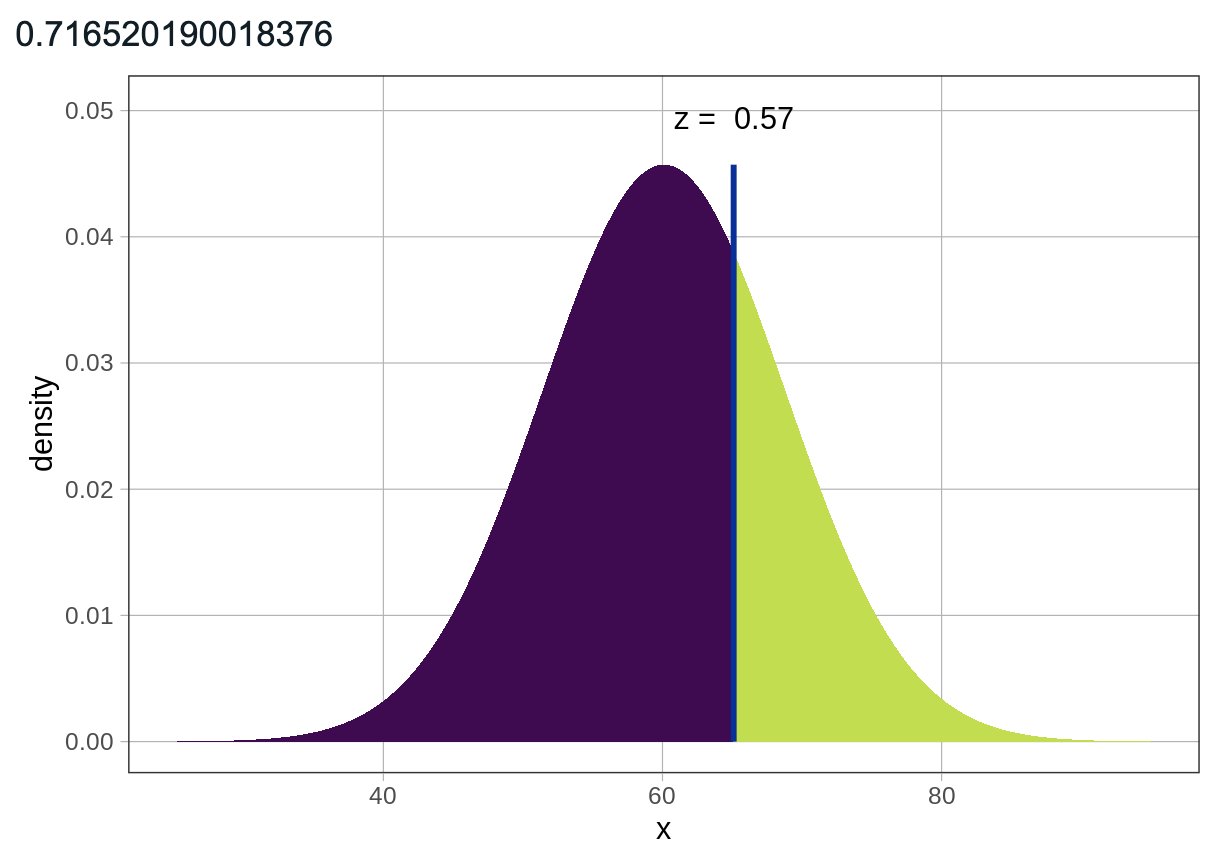
Perhaps you would like to know the z-score/probability of a thumb length that is 65.1 mm. Below are a few different approaches you might use for indicating the mean and standard deviation arguments (they all produce the same output).
# Method 1: Save mean/sd as a favstats() object
thumb_stats <- favstats(~Thumb, data = Fingers)
xpnorm(65.1, thumb_stats$mean, thumb_stats$sd)
# Method 2: use mean/sd exact values
xpnorm(65.1, mean = 60.10, sd = 8.73)
# Method 3: use mean/sd functions
xpnorm(65.1, mean = mean(Fingers$Thumb), sd = sd(Fingers$Thumb))
Example of output:


The output can be roughly interpreted as reporting that the z-score for a thumb length of 65.1, in the context of a normal distribution with a mean of 60.10 and a standard deviation of 8.73, is z = 0.57 (65.1 is 0.57 standard deviations above the mean). It continues to report that the probability of a value less than or equal to X (65.1), or a z-score less than or equal to 0.57, is about 0.72, and the probability of a value greater than X (65.1), or a z-score greater than 0.57, is about 0.28.