tally()
The tally() function will count, or tally, the number of cases that are observed in each category of a variable.
 Example 1:

Example 1:
Use tally() to count the number of observations in each category of a categorical variable.
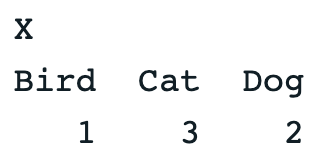
# Use tally() to count the number of pets in each group
pets <- c("Dog", "Cat", "Dog", "Cat", "Cat", "Bird")
tally(pets)
Example output:
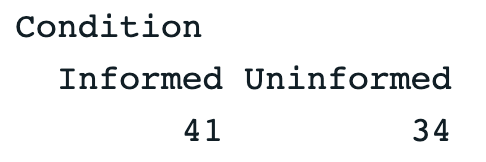
# Use tally() to count the number of participants in each Condition
tally(~ Condition, data = MindsetMatters)
Example output:
 Example 2:

Example 2:
Use tally() with >, <, >=, <=, ==, != to count the number of cases that match a specified criterion.
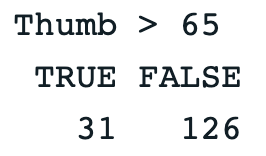
# Use tally() to count the number of thumb lengths greater than 65 mm
# This will return a True/False count
tally(~ Thumb > 65 , data = Fingers)
Example output:
# Count the number of Informed participants
# This will return a True/False count
tally(~ Condition=="Informed", data = MindsetMatters)
Example output:

 Example 3:

Example 3:
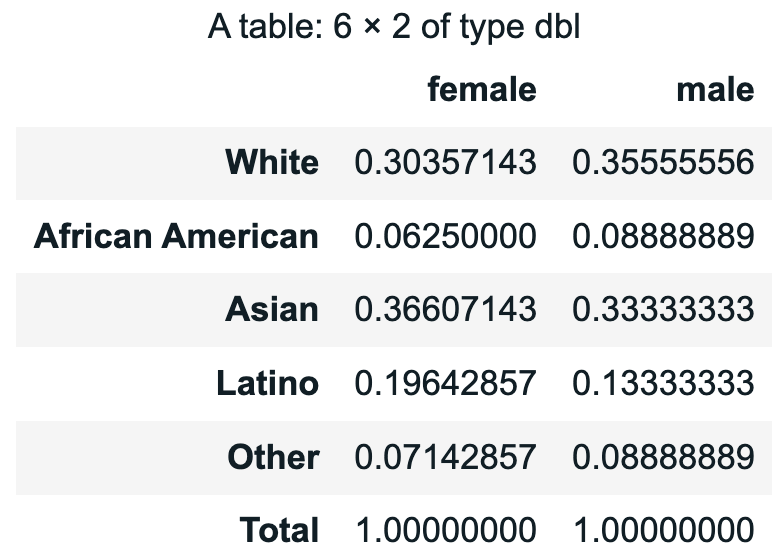
Add an additional variable to include in the tally, and add arguments such as 'margins = TRUE' and 'format = "proportion"'.
# Tally the proportion of RaceEthnic by Gender
tally(RaceEthnic ~ Gender, data = Fingers, margins = TRUE, format = "proportion")
Example output:
 Example 4:

Example 4:
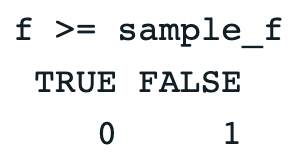
Use tally() to get probabilities for sampling distributions. You can also use '|' for Union and '&' for Intersectional probabilities.
# Generate 1000 Fs from randomized (shuffled) data
# and save them into an object called sdoF
sdoF <- do(1000) * f(shuffle(Thumb) ~ Gender, data = Fingers)
# Save the sample F value
sample_f <- f(Thumb ~ Gender, data = Fingers)
# Get the proportion of Fs that are
# equal to or greater than the sample F
tally(~f >= sample_f, data = sdoF, format = "proportion")
Example output:
# Intersection = &
tally(~ (Job=="Not Working" & Interest=="Very Interested"), data = Fingers)
# Divide by N to get the probability
tally(~ (Job=="Not Working" & Interest=="Very Interested"), data = Fingers) / 157
Example output:

# Union = |
tally(~ (Job=="Not Working" | Interest=="Very Interested"), data = Fingers)
# Divide by N to get it as a proportion
tally(~ (Job=="Not Working" | Interest=="Very Interested"), data = Fingers) / 157
Example output:
