shuffle()
The shuffle() function will mix up, or "shuffle", the values in a column into a randomized order. It is one possible method for simulating a random data generating process (DGP).
 Example 1:
Example 1:
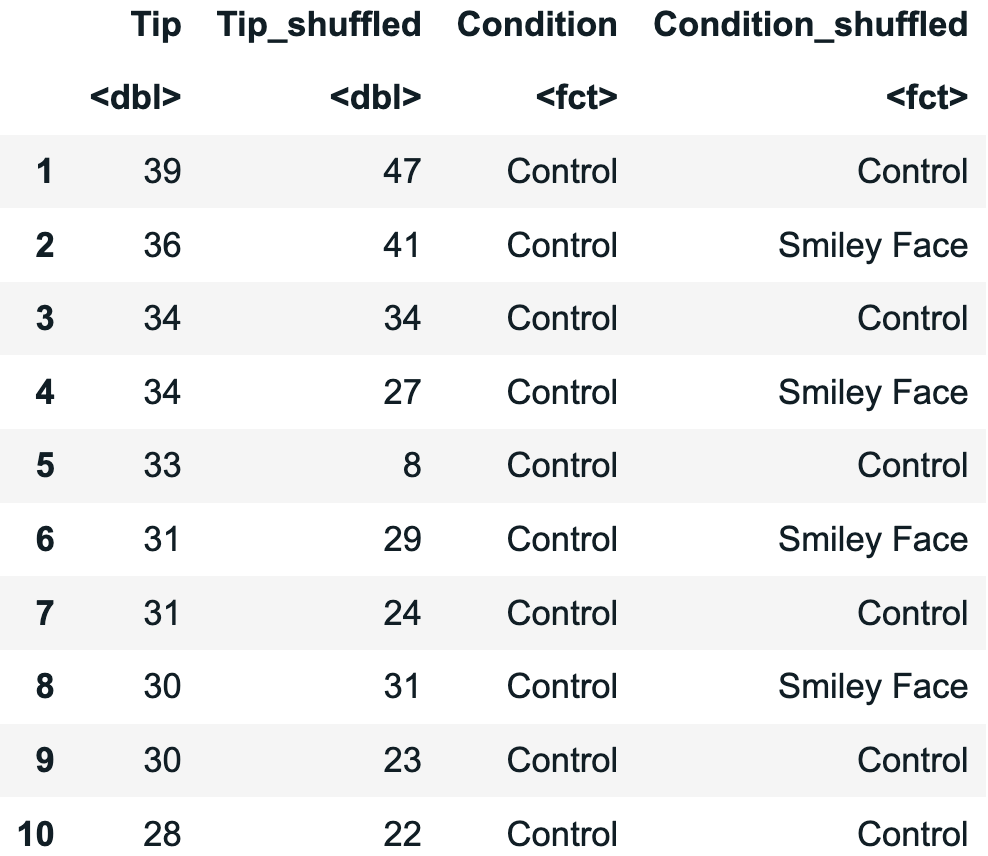
One way to see how the shuffle() function works is by comparing a column before and after shuffling the variable.
# Shuffle the Tip values and save them as a new variable in the data frame
TipExperiment$Tip_shuffled <- shuffle(TipExperiment$Tip)
# Shuffle the Condition values and save them as a new variable in the data frame
TipExperiment$Condition_shuffled <- shuffle(TipExperiment$Condition)
# Print out a few rows to compare the original values to the shuffled values
head(select(TipExperiment, Tip, Tip_shuffled, Condition, Condition_shuffled), 10)
Example output from running the code above:
Example 2:
Example 2:
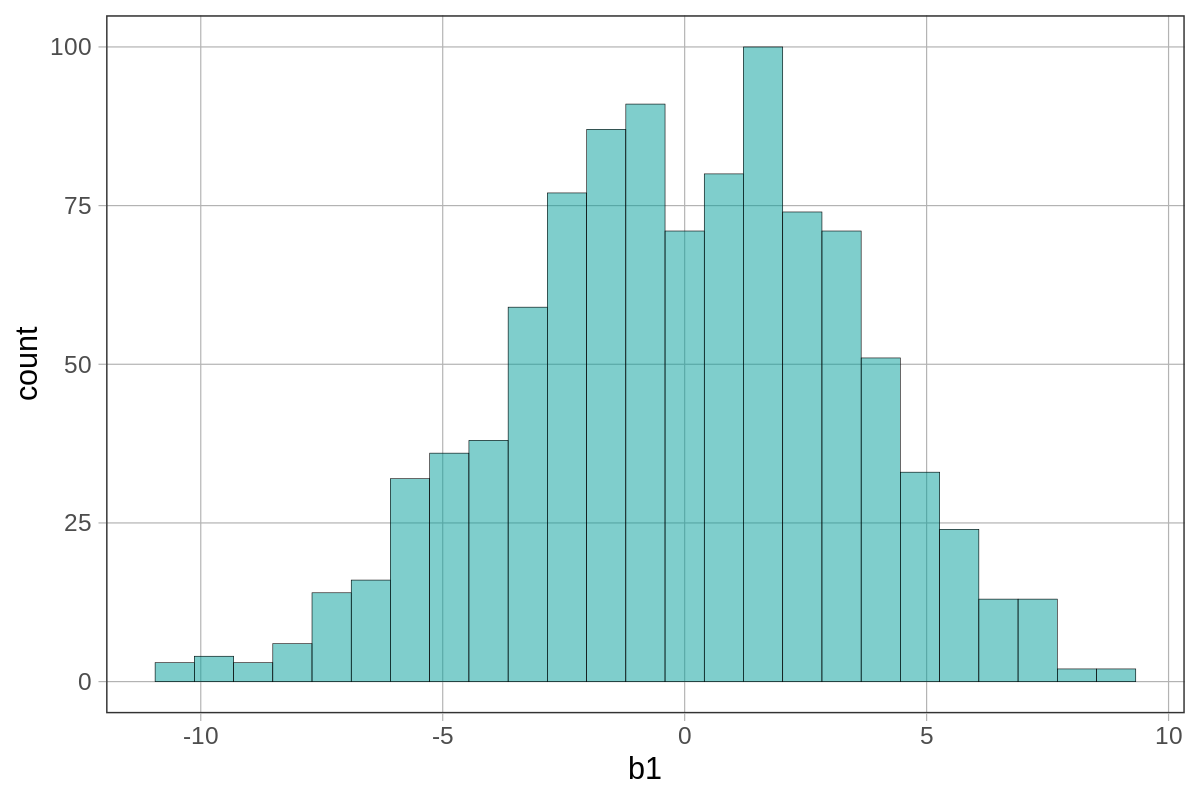
The shuffle() function can also be useful for constructing sampling distributions of various statistics (e.g., b1, PRE, F).
# Generate 1000 b1 estimates from a random DGP, and save into a data frame
sampling_dist_of_random_b1s <- do(1000) * b1(shuffle(Tip) ~ Condition, data = TipExperiment)
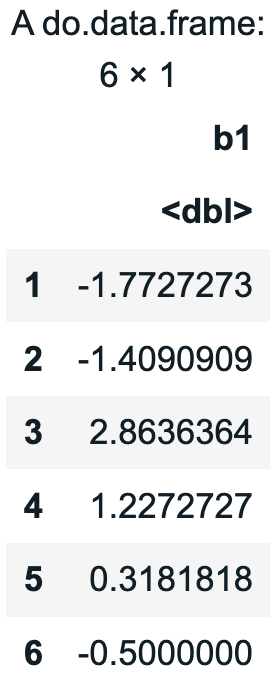
# Take a look at some of the data frame
head(sampling_dist_of_random_b1s)
# Plot the distribution of those 1000 random b1 estimates
gf_histogram(~b1, data = sampling_dist_of_random_b1s)
Example output from running the code above:
Related Articles
gf_point()
The gf_point() function can be used to create a scatterplot, or to plot a specified point, such as a specific value along the x-axis. Example 1: gf_point( Thumb ~ Height , data = Fingers , size = 2 ) Example of output from running the code above: ...f() or fVal()
The f() function (and, similarly, the fVal() function) will calculate the F value for a model. Example 1: Below are various methods for indexing the model in the argument of the f() function (they will all produce the same output). For any of these, ...pre() and PRE()
The pre() function (and, similarly, the PRE() function) will calculate the PRE (Proportional Reduction in Error) value for a model. Example 1: Below are various methods for indexing the model in the argument of the pre() function (they will all ...b1()
The b1() function will calculate the b1 value for a model. Example 1: Below are various methods for indexing the model in the argument of the b1() function (they will all produce the same output). # Method 1: Find the b1 value for the Gender model of ...tally()
The tally() function will count, or tally, the number of cases that are observed in each category of a variable. Example 1: Use tally() to count the number of observations in each category of a categorical variable. # Use tally() to count the number ...