sample()
The sample() function will take a random sample of rows from the data frame, without replacement (of the specified sample size).
For random sampling with replacement, see the resample() function.
 Example 1:
You can take a closer look at how the sample() function works by looking at a couple of examples using a small sample size. In the example code below, you will see how you can take a random sample of rows (without replacement) for a single variable in the row, or for the whole row.
# You can sample rows (without replacement) for a specific variable
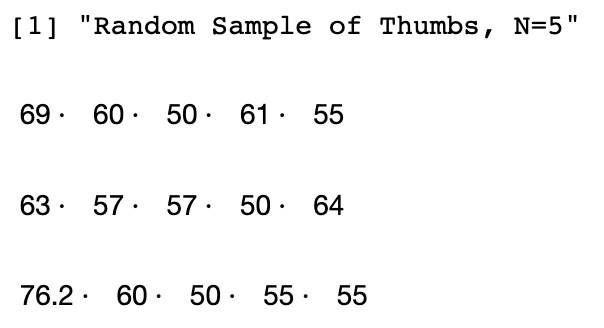
# Try sampling 5 Thumb lengths from Fingers a few times
# Notice that you get various combinations of the sample values
print("Random sample of Thumbs, N=5")
sample(Fingers$Thumb, 5)
sample(Fingers$Thumb, 5)
sample(Fingers$Thumb, 5)
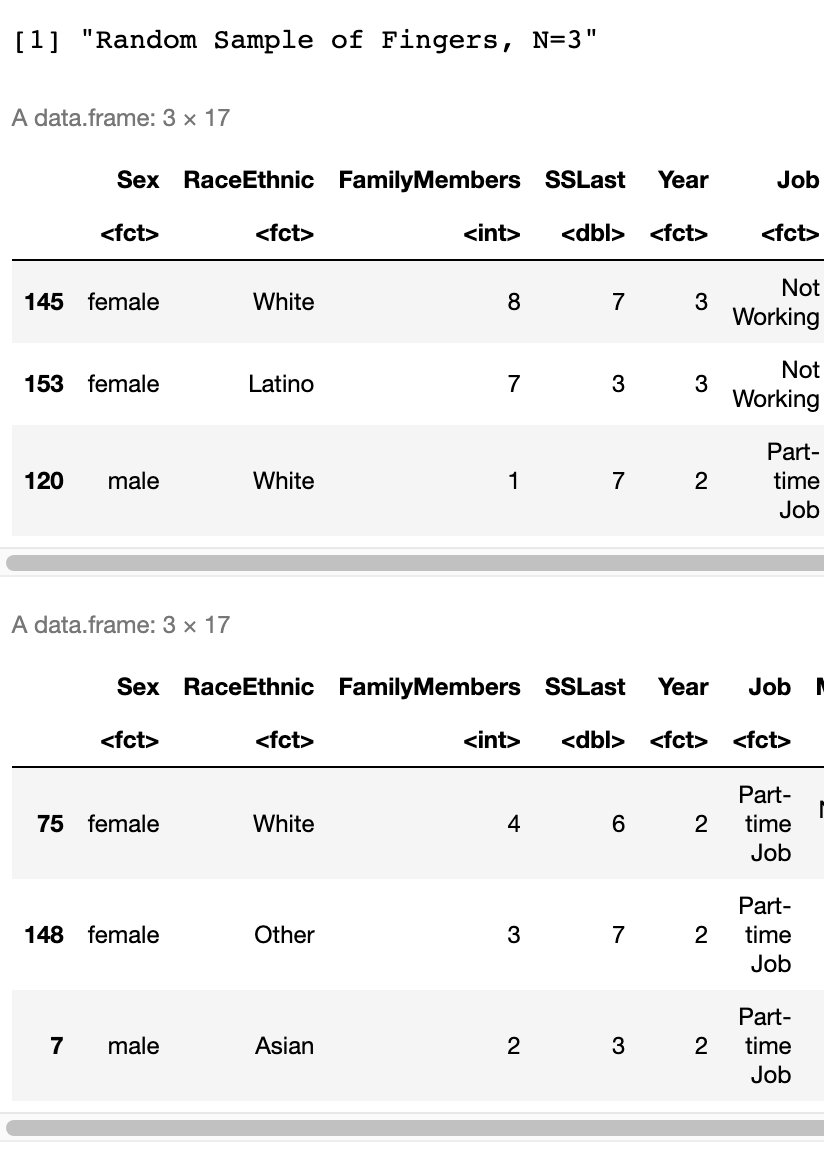
# Or you can sample the whole row
# Try sampling 3 whole rows from Fingers a couple of times
print("Sampled Fingers, N=3")
sample(Fingers, 3)
sample(Fingers, 3)
Example of output from running the code above (your values may vary due to sampling variation):
Example 2:
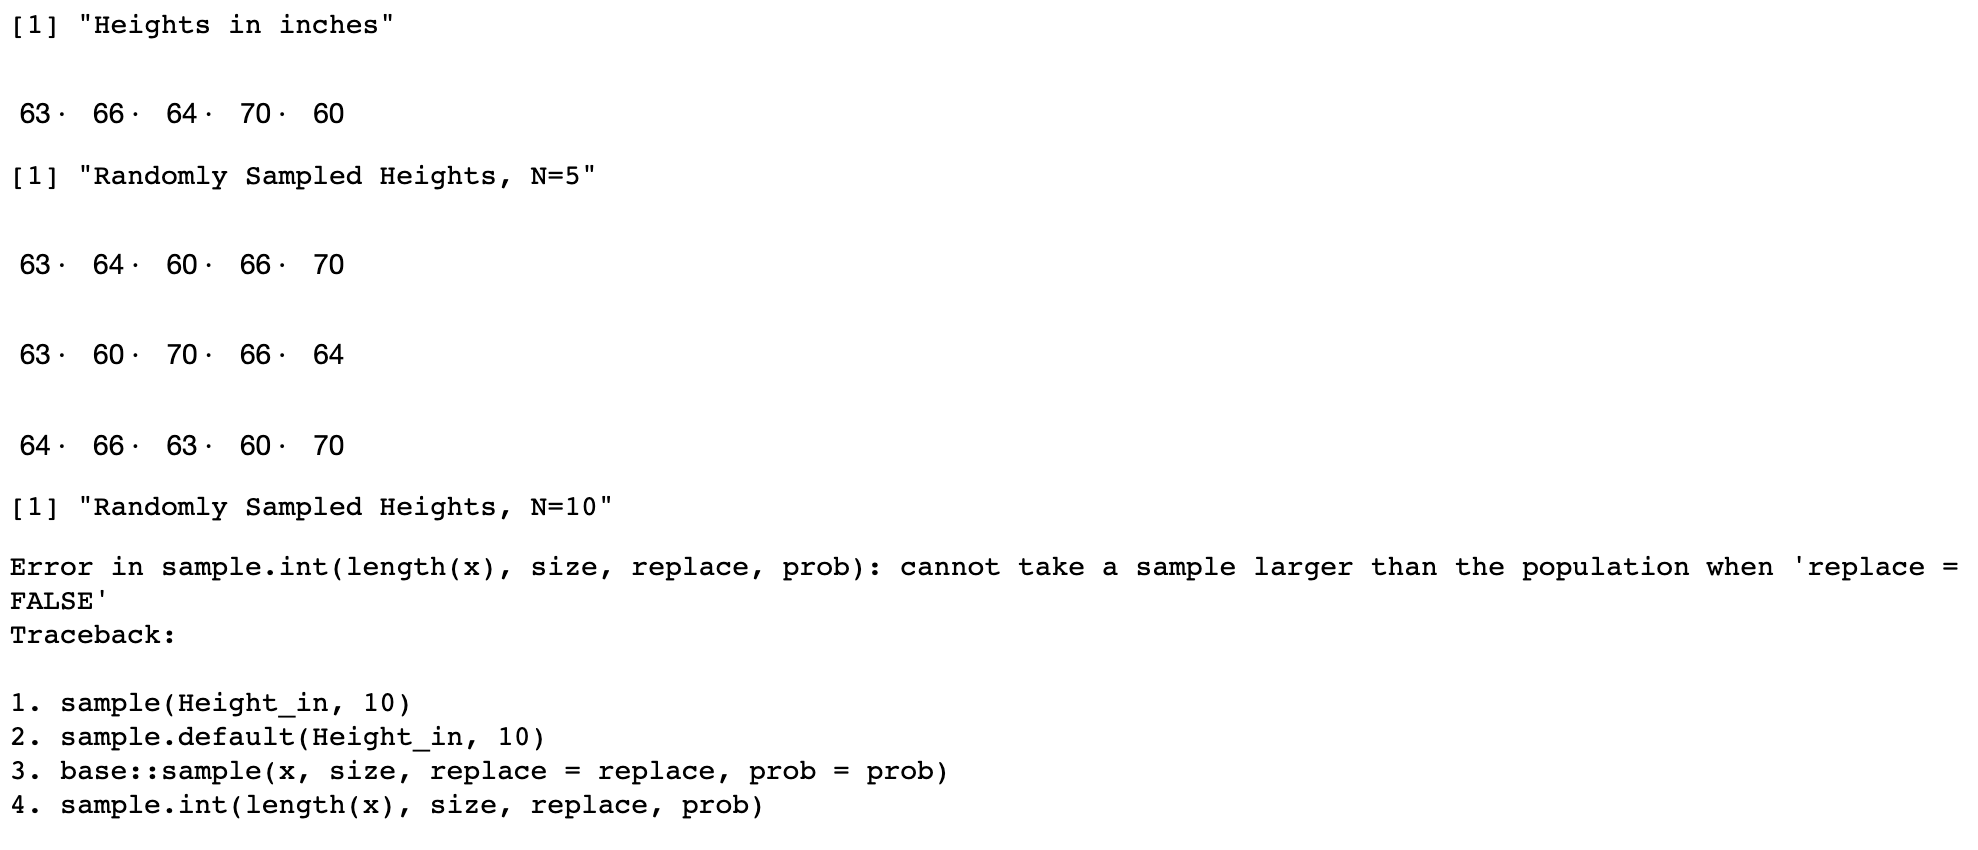
What happens if you take a sample greater than the number of rows in the data? Take a look with this small dataset.
# A small vector with 5 heights (in inches)
Height_in <- c(63, 66, 64, 70, 60)
print("Heights in inches")
Height_in
# Try sampling from the vector a few times
# Notice that you get various combinations of the sample values (without replacement of values)
print("Randomly Sampled Heights, N=5")
sample(Height_in, 5)
sample(Height_in, 5)
sample(Height_in, 5)
# What happens if you take a sample greater than the number of values in the sample?
print("Randomly Sampled Heights, N=10")
sample(Height_in, 10)
sample(Height_in, 10)
sample(Height_in, 10)
Example of output from running the code above (your values may vary due to sampling variation):
Example 3:
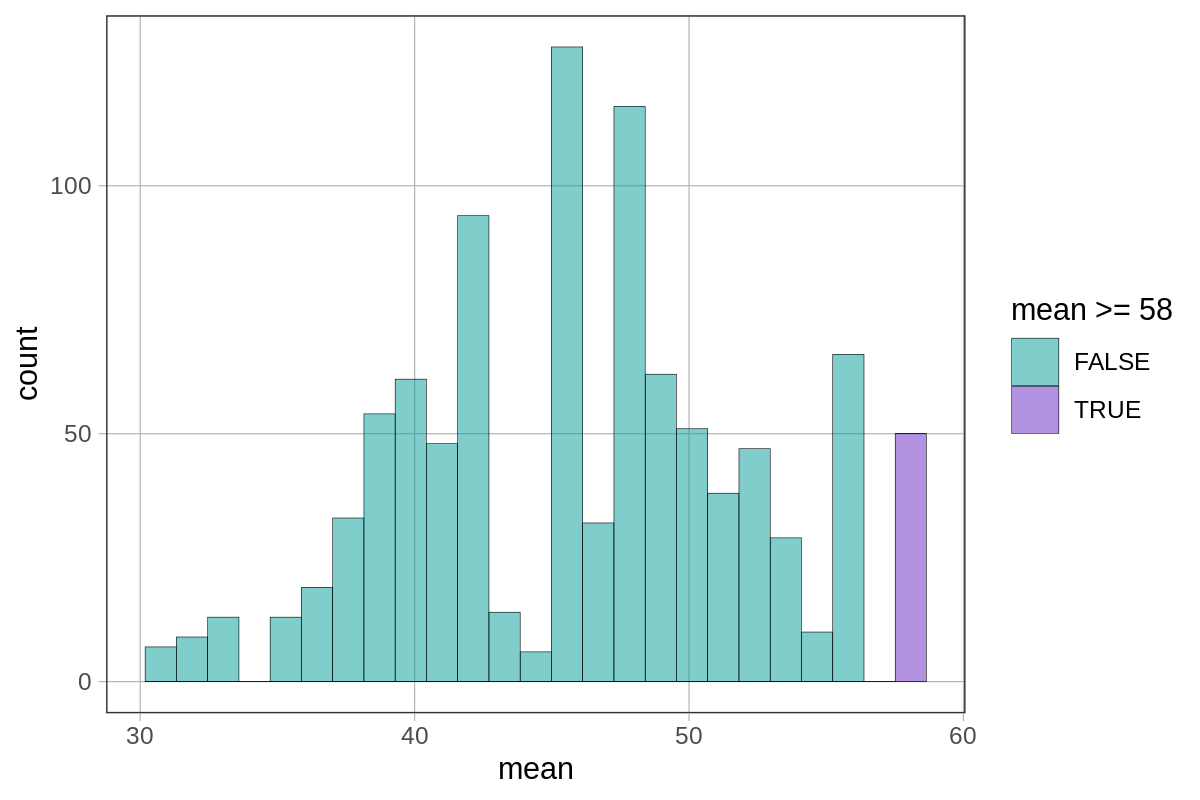
Here is an example of how to construct a sampling distribution of means using sample(). It is demonstrated in the context of the Martin v. Westvaco scenario (Martin sued his employer, Westvaco, for age discrimination).
# Save the ages of everyone in Martin's department into an object
everyone <- c(25, 33, 35, 38, 48, 55, 55, 55, 56, 64)
# Generate 1000 samples of 3 people to be randomly "fired" and calculate the mean age of each sample
# Save them into a data frame
SDoM <- do(1000) * mean(sample(everyone, 3))
# Plot all the means and fill in the ones equal to or greater than the actual sample mean
gf_histogram(~ mean, data = SDoM, fill = ~mean>=58)
Example of output from running the code above (your values may vary due to sampling variation):
Related Articles
sample distribution
When sampled data—units that were selected and measured—are shown in such a way where we can see patterns of variation (such as shape, center, and spread); sample distributions can be seen in visualizations such as histograms, boxplots, etc. but also ...sampling without replacement
Sampling without replacement takes a sample from a population, remove the object sampled, then sample again from the remaining objects in the population; the R function sample() does this.sampling error
Sampling error is the variation that occurs from sample to sample due to the fact that no sample is a perfect representation of the population; can be biased or unbiased; also known as sampling variation.sampling with replacement
Sampling with replacement takes a sample from a population, record the values, put all cases back into the population, then sample again; the R function resample() does this.distribution triad
Distribution triad means sample distribution, DGP/population distribution and sampling distribution.