pre() and PRE()
The pre() function (and, similarly, the PRE() function) will calculate the PRE (Proportional Reduction in Error) value for a model.
 Example 1:
Below are various methods for indexing the model in the argument of the pre() function (they will all produce the same output). For any of these, pre() can be replaced with PRE().
Example 1:
# Method 1: Find the PRE value for the Gender model of Thumb
pre(Thumb ~ Gender, data = Fingers)
# Method 2: Save the model first
gender_model <- lm(Thumb ~ Gender, data = Fingers)
pre(gender_model)
# Method 3: Use the lm() function within the pre() function
pre(lm(Thumb ~ Gender, data = Fingers))
Example output:
Example 2:
Below is an example of using the pre() function to generate a sampling distribution of PRE, then plotting the distribution, and plotting the sample PRE value on the graph.
# Generate 1000 PREs from randomized (shuffled) data
# and save them into an object called sdoPRE
sdoPRE <- do(1000) * pre(shuffle(Thumb) ~ Gender, data = Fingers)
# Save and print out the sample PRE value
sample_pre <- pre(Thumb ~ Gender, data = Fingers)
sample_pre
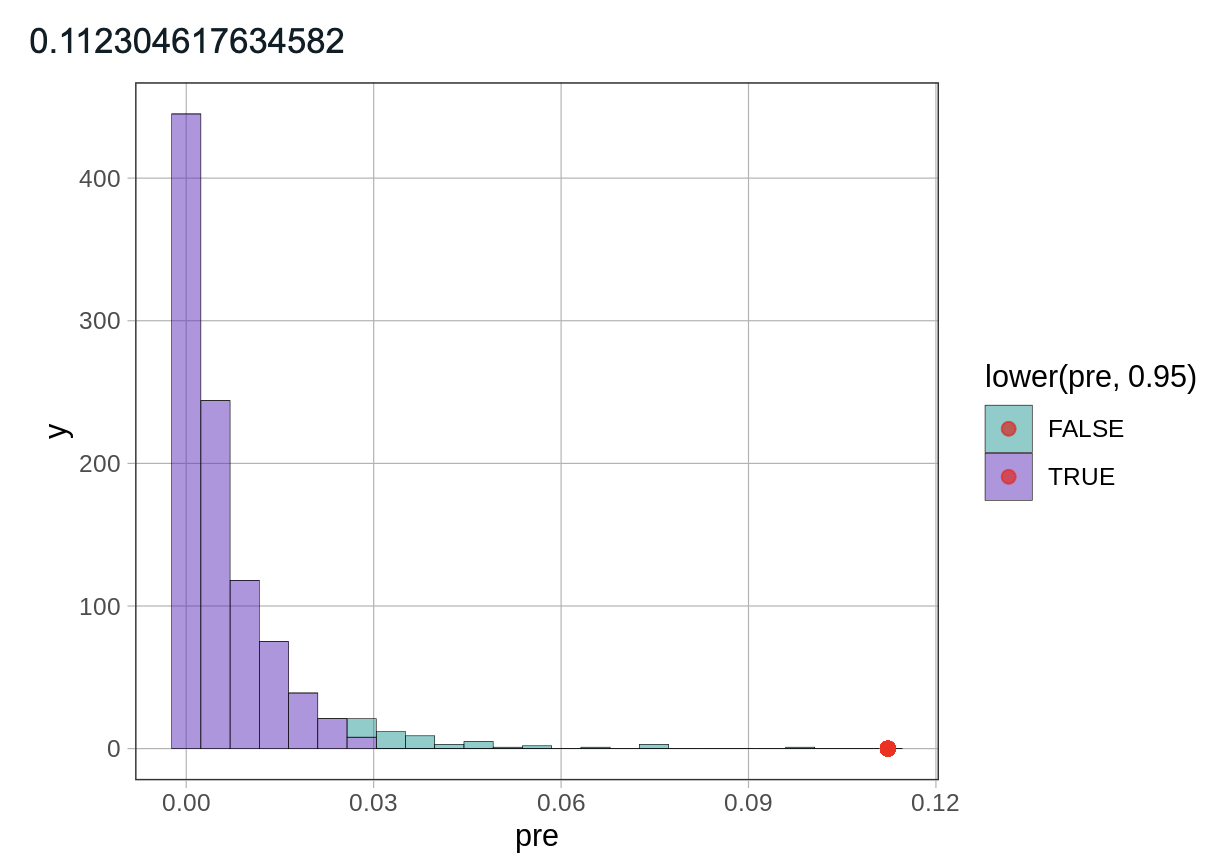
# Plot the sampling distribution with the sample PRE
gf_histogram(~ pre, data = sdoPRE, fill = ~lower(pre, .95)) %>%
gf_point(0 ~ sample_pre, color = "red")
Example output:
Related Articles
proportion reduction in error (PRE)
Proportion reduction in error (PRE) is the proportion of error that has been reduced by a more complex model compared with a simpler model, which in our course is always the empty model. When comparing to the empty model, PRE is calculated as SS ...Using the R Sandbox
The R Sandbox The R Sandbox is a separate R window you can use to experiment with R code and play around with ideas from the course. It comes pre-loaded with the base R packages and all of the packages and datasets we reference in the textbook. ...shuffle()
The shuffle() function will mix up, or "shuffle", the values in a column into a randomized order. It is one possible method for simulating a random data generating process (DGP). Example 1: One way to see how the shuffle() function works is by ...supernova()
The supernova() function will compute an analysis of variance (ANOVA) for a model, and present the statistics in a modified ANOVA table, that includes: - sums of squares (SS) - degrees of freedom (df) - mean squares (MS) - proportional reduction in ...resample()
The resample() function will take a random sample of rows from the data frame, with replacement (of the specified sample size). It can be useful if you want to bootstrap a sampling distribution of statistics (e.g., b1, PRE, F) (Bootstrapping ...