gf_vline()
The gf_vline() function will add a vertical line onto a plot. You can plot the line by referencing a value in a data frame (Example 1), or by specifying the point along the axis where the line should run through (Example 2).
 Example 1:
Example 1:
# Save the mean into a data frame using favstats()
Thumb_stats <- favstats(~Thumb, data = Fingers)
# Plot the mean on a histogram with a vertical line
gf_histogram(~Thumb, data = Fingers) %>%
gf_vline( xintercept = ~mean , data = Thumb_stats , color = "blue" , size = 2)
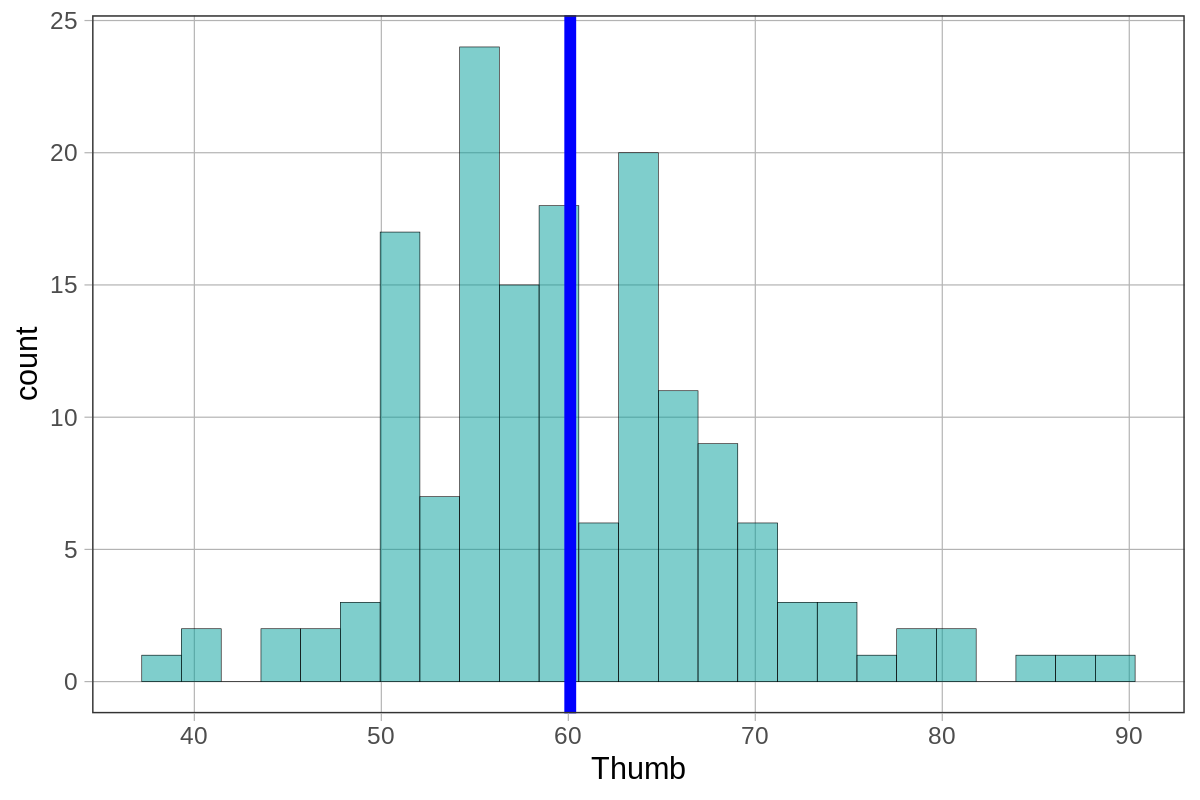
Example of output from running the code above:
Example 2:
# Plot the mean of 60.1 on a histogram with a vertical line
gf_histogram(~Thumb, data = Fingers) %>%
gf_vline( xintercept = 60.1, color = "blue" , size = 2)
Example of output from running the code above: