gf_jitter()
The gf_jitter() function will generate a jitter plot. A jitter plot is a point plot (similar to a scatter plot, such as gf_point()) but the points are moved slightly ("jittered") so that they do not overlap as much. This can help make it easier to see the frequency of values.
Arguments such as the size of the points (size = ) and the transparency of the points (alpha = ) can be manipulated as well to aid in interpretation of the distribution.
Jitter plots can also be chained together with other plots, such as boxplots.
 Example 1:
Example 1:
# Jitter plot with categorical explanatory variable
gf_jitter(Thumb ~ Gender , data = Fingers , color = "orange" , size = 5 , alpha = .5 , width = .08)
Example of output from running the code above:
Example 2:
# Jitter plot with quantitative explanatory variable
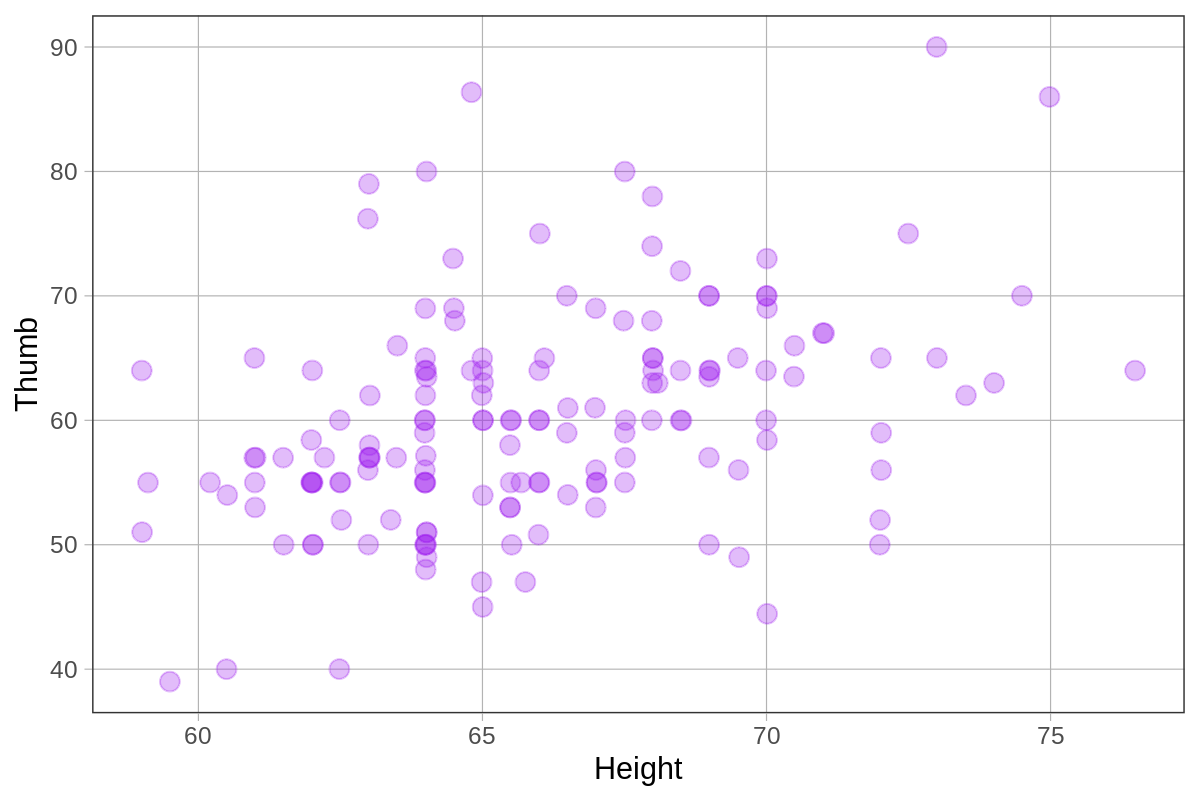
gf_jitter( Thumb ~ Height , data = Fingers , color = "purple" , size = 3 , alpha = .3 )
Example of output from running the code above:
Example 2:
# Jitter plot with quantitative explanatory variable
gf_jitter( Thumb ~ Height , data = Fingers , color = "purple" , size = 3 , alpha = .3 )
Example of output from running the code above: