gf_dist()
The gf_dist() function can graphically overlay a number of different mathematical probability distributions. If we want to overlay the normal distribution, we’ll have to specify that with the argument “norm”, and then enter in the mean and standard deviation as parameters.
 Example 1:
Example 1:
# First save the mean and standard deviation from favstats()
Thumb.stats <- favstats(~ Thumb, data = Fingers)
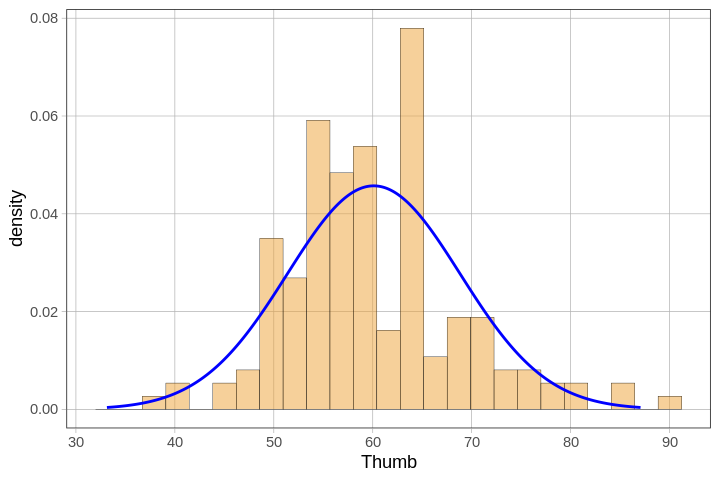
# Overlay the best fitting normal model (in blue) onto the distribution of Thumb in Fingers
gf_dhistogram(~ Thumb, data = Fingers) %>%
gf_dist( "norm" , color = "blue" , params = list( Thumb.stats$mean, Thumb.stats$sd ))
Example of output from running the code above:
Example 2:
Example 2:
# Alternatively, you can just directly specify the mean and standard deviation
gf_dhistogram(~ Thumb, data = Fingers) %>%
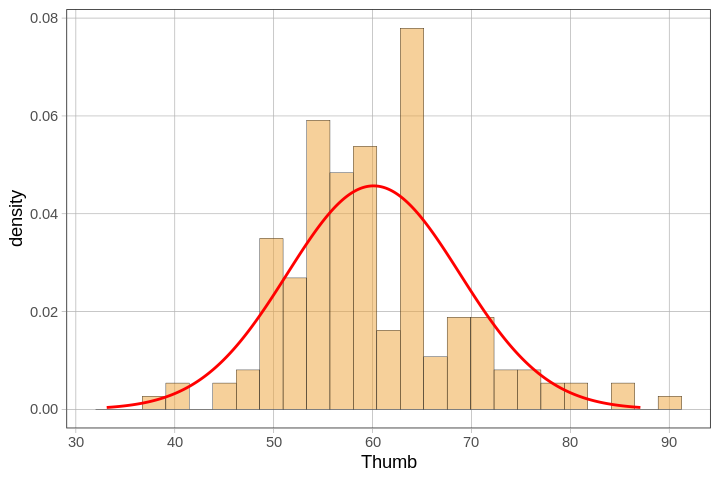
gf_dist( "norm" , color = "red" , params = list(mean = 60.10, sd = 8.73))
Example of output from running the code above: