gf_density()
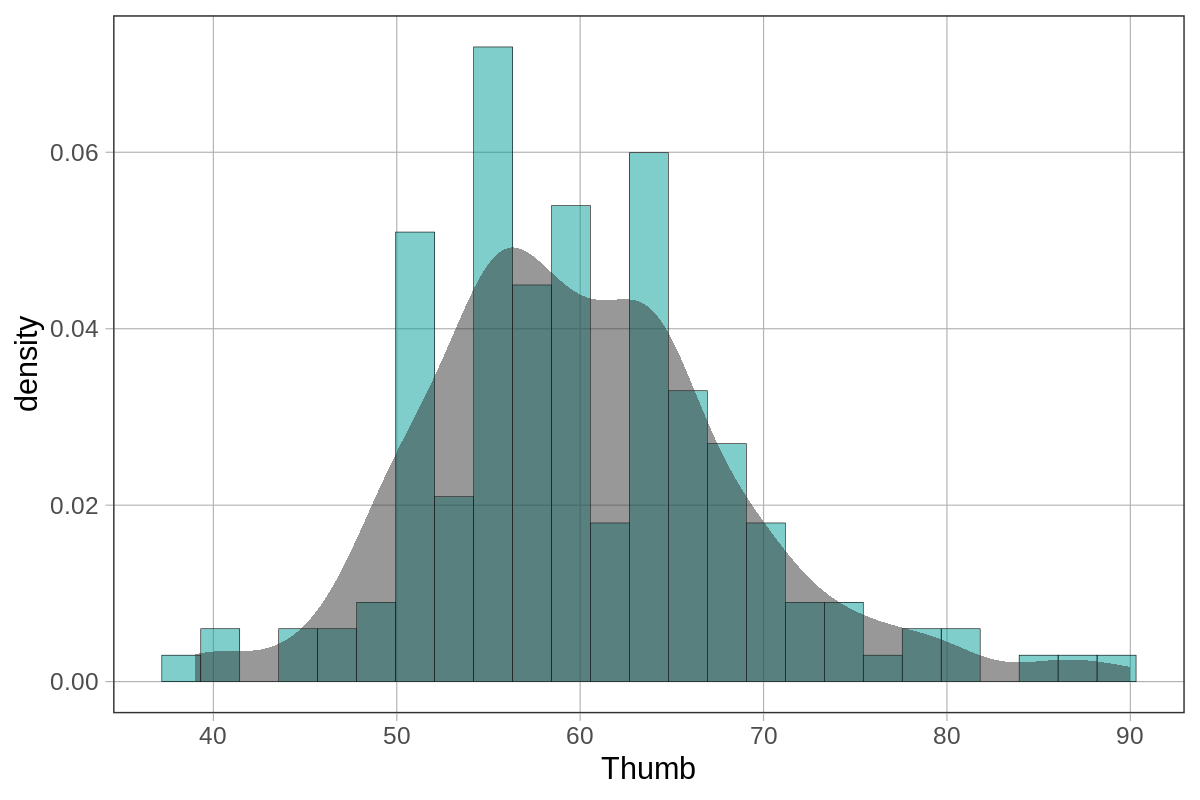
The gf_density() function will overlay a density plot onto a density histogram (i.e., gf_dhistogram(), not gf_histogram()). The density plot is a smoothed out version of the distribution. They can be helpful when you want to get a better idea of the approximate shape of the distribution (e.g., normal, bimodal, skewed, uniform).
 Example 1:
Example 1:
# A density plot chained onto a density histogram
gf_dhistogram(~Thumb, data = Fingers) %>%
gf_density()
Example of output from running the code above:
Example 2:
# A density plot with color arguments, chained onto a faceted density histogram
gf_dhistogram(~Thumb, data = Fingers, fill = "grey", color = "black") %>%
gf_facet_grid(Gender ~ .) %>%
gf_density(color = "red", fill = "blue")
Example of output from running the code above:
