gf_boxplot()
The gf_boxplot() function will generate a boxplot (also known as a box and whiskers plot).
A boxplot splits the data into quartiles, where each whisker and each half of the box contains 25% of all the observations. They are helpful for visualizing the five-number summary (minimum, Q1, Q2/median, Q3, maximum) for a single quantitative variable. Outliers appear as points beyond the whiskers.
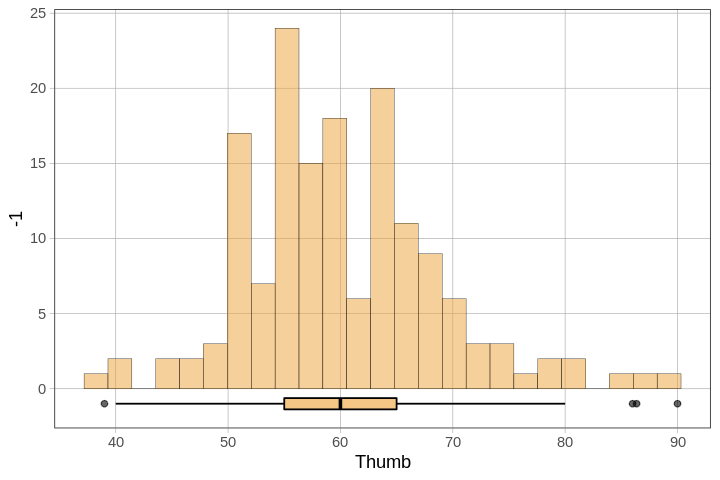
Boxplots can also be split into the groups of a categorical variable, and they can also be chained onto other plots (e.g., histograms and jitter plots).
 Example 1:
Example 1:
# Boxplot of Wt in MindsetMatters
gf_boxplot( Wt ~ 1 , data = MindsetMatters )
Example of output from running the code above:
Example 2:
Example 2:
# Boxplot of Thumb by Height3Group in Fingers
gf_boxplot( Thumb ~ Height3Group , data = Fingers )
Example of output from running the code above:
Example 3:
Example 3:
# Boxplot and histogram of Thumb in Fingers
gf_histogram(~ Thumb, data = Fingers) %>%
gf_boxplot( -1 ~ Thumb)
Example of output from running the code above: