f() or fVal()
The f() function (and, similarly, the fVal() function) will calculate the F value for a model.
 Example 1:
Below are various methods for indexing the model in the argument of the f() function (they will all produce the same output). For any of these, f() can be replaced with fVal().
Example 1:
# Method 1: Find the F value for the Gender model of Thumb
f(Thumb ~ Gender, data = Fingers)
# Method 2: Save the model first
gender_model <- lm(Thumb ~ Gender, data = Fingers)
f(gender_model)
# Method 3: Use the lm() function within the f() function
f(lm(Thumb ~ Gender, data = Fingers))
Example output:

Example 2:
Example 2:
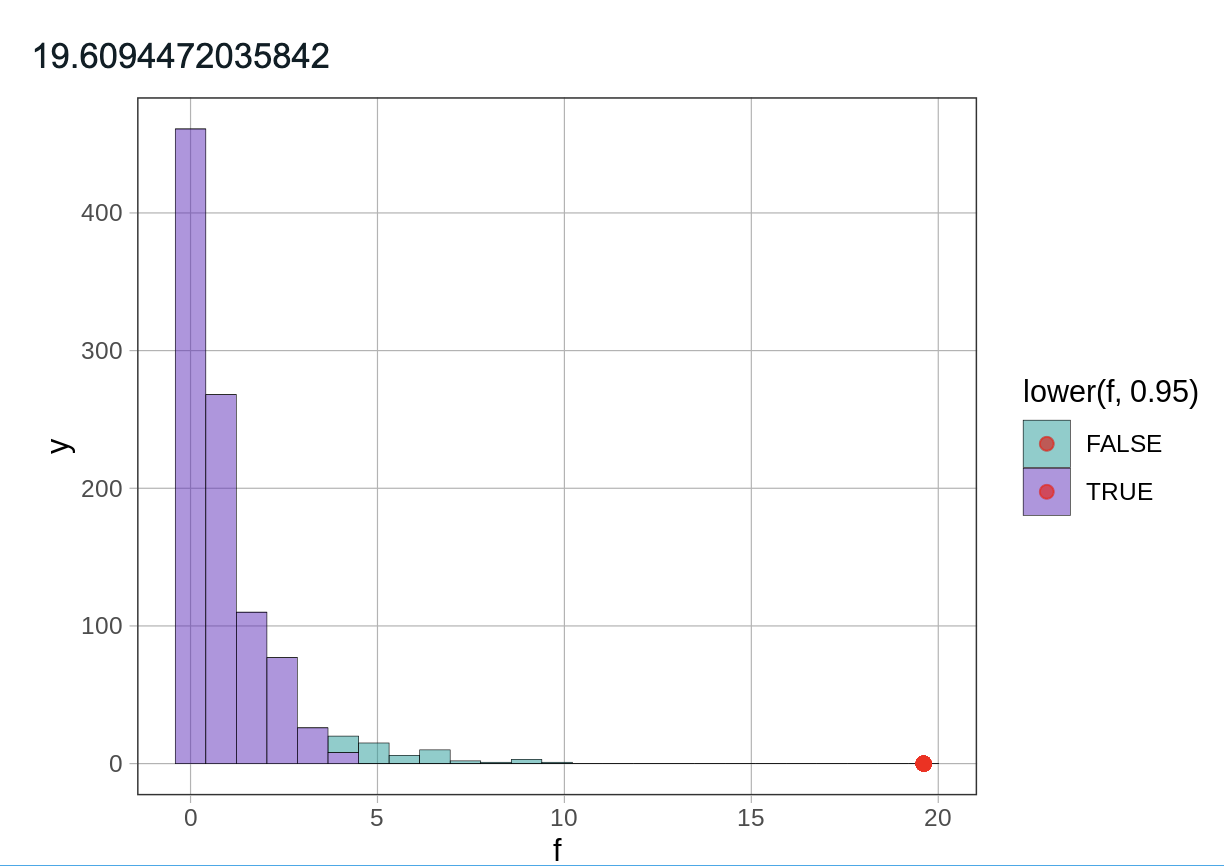
Below is an example of using the f() function to generate a sampling distribution of F, then plotting the distribution, and plotting the sample F value on the graph.
# Generate 1000 Fs from randomized (shuffled) data
# and save them into an object called sdoF
sdoF <- do(1000) * f(shuffle(Thumb) ~ Gender, data = Fingers)
# Save and print out the sample F value
sample_f <- f(Thumb ~ Gender, data = Fingers)
sample_f
# Plot the sampling distribution with the sample F
gf_histogram(~ f, data = sdoF, fill = ~lower(f, .95)) %>%
gf_point(0 ~ sample_f, color = "red")
Example output:
Related Articles
F test
F test is a method for using the F ratio and F distribution to compare statistical models.F-Distribution
The F-Distribution is a probability distribution that models the sampling distribution of F under the empty model (the null hypothesis that there is no effect of the explanatory variable); this theoretical distribution takes into account both model ...t-test
The t-test uses the t-distribution (a sampling distribution of t) as a method of model comparison when you are evaluating a complex model against the empty model. It is very similar to using the F-distribution for model comparison, and, actually, ...tally()
The tally() function will count, or tally, the number of cases that are observed in each category of a variable. Example 1: Use tally() to count the number of observations in each category of a categorical variable. # Use tally() to count the number ...Sampling Error
Sampling error is the difference between a result calculated from a sample and the corresponding value in the population or data generating process (DGP). Sampling error occurs because different random samples contain different observations. Even ...