Faceted Plots
Faceted plots are meant for use when you have a categorical variable. You can use the categorical variable to partition the data into different groups and the groups are then plotted in different panels called facets. Thus, you can use a facet grid to compare the distributions of two (or more) groups on the same variable.
 Example 1:
Example 1:
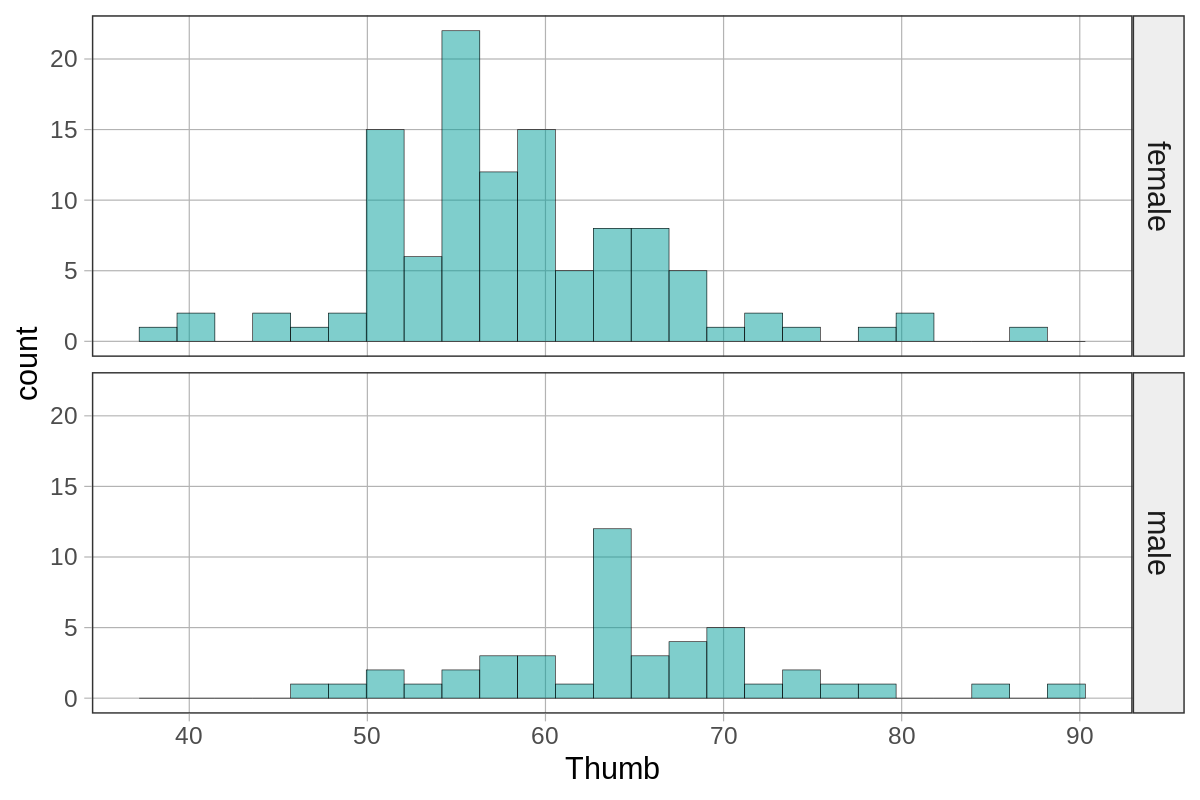
# Make a faceted histogram of Thumb by Gender in the Fingers data frame
gf_histogram(~Thumb, data = Fingers) %>%
gf_facet_grid(Gender ~ .)
Example of output from running the code above:
Example 2:
Example 2:
# Make a faceted bar graph of RaceEthnic by Gender in the Fingers data frame
gf_bar(~RaceEthnic, data = Fingers) %>%
gf_facet_grid(Gender ~ .)
Example of output from running the code above:

# You can switch the facet variable to the other side of the tilde (~) to change whether the facets are vertical or horizontal
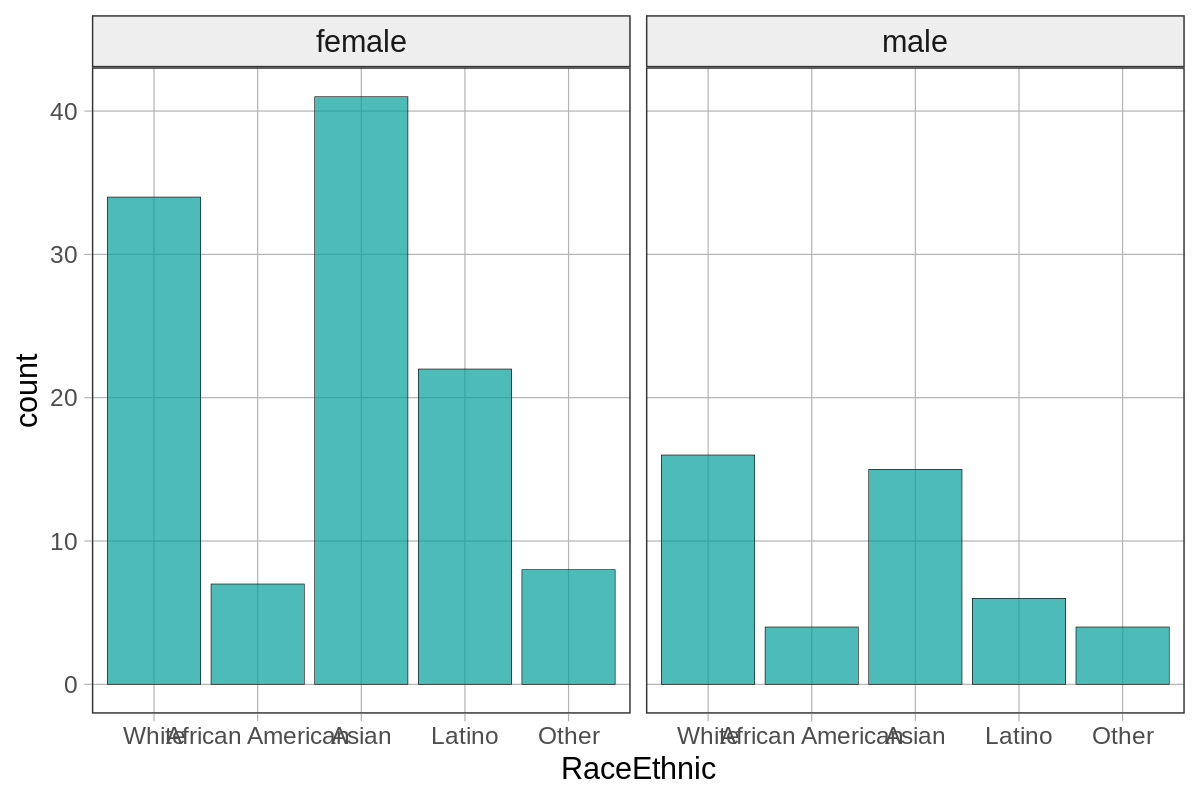
gf_bar(~RaceEthnic, data = Fingers) %>%
gf_facet_grid(. ~ Gender)
Example of output from running the code above:
Example 3:
Example 3:
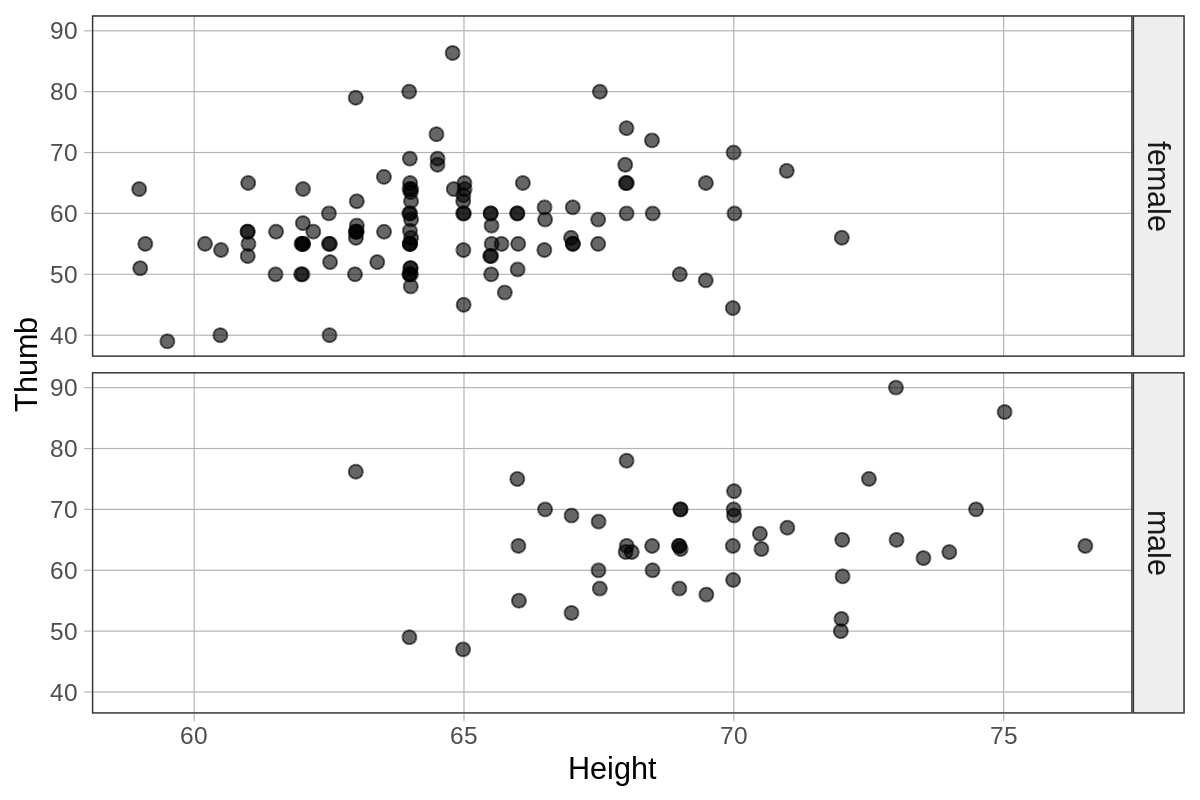
# Make a faceted jitter plot of Thumb and Height by Gender in the Fingers data frame
gf_jitter(Thumb ~ Height, data = Fingers) %>%
gf_facet_grid(Gender ~ .)
Example of output from running the code above: