b1()
The b1() function will calculate the b1 value for a model.
 Example 1:
Below are various methods for indexing the model in the argument of the b1() function (they will all produce the same output).
Example 1:
# Method 1: Find the b1 value for the Gender model of Thumb
b1(Thumb ~ Gender, data = Fingers)
# Method 2: Save the model first
gender_model <- lm(Thumb ~ Gender, data = Fingers)
b1(gender_model)
# Method 3: Use the lm() function within the b1() function
b1(lm(Thumb ~ Gender, data = Fingers))
Example output:
Example 2:
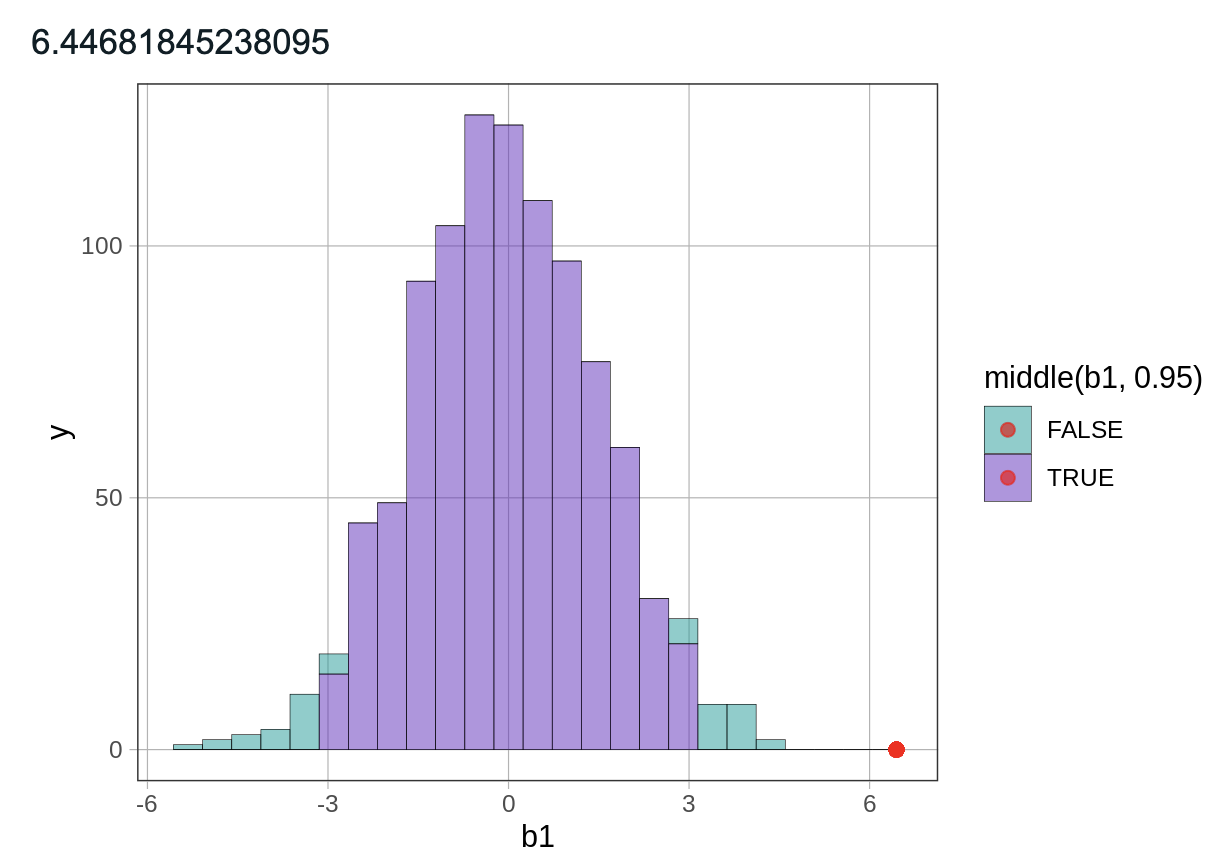
Below is an example of using the b1() function to generate a sampling distribution of b1, then plotting the distribution, and plotting the sample b1 value on the graph.
# Generate 1000 b1s from randomized (shuffled) data
# and save them into an object called sdob1
sdob1 <- do(1000) * b1(shuffle(Thumb) ~ Gender, data = Fingers)
# Save and print out the sample b1 value
sample_b1 <- b1(Thumb ~ Gender, data = Fingers)
sample_b1
# Plot the sampling distribution with the sample b1
gf_histogram(~ b1, data = sdob1, fill = ~middl(b1, .95)) %>%
gf_point(0 ~ sample_b1, color = "red")
Example output:
Related Articles
intercept
Intercept is the value where a line intersects with the y-axis; the value of y when the x is 0; for example, in the equation for a line, y = mx + b, the y-intercept is represented by b.R Objects
R Objects Overview In R, everything is an object. Data, functions, models, and even results of calculations are all stored as objects. Understanding R objects is fundamental to working with data, writing reproducible code, and performing statistical ...What are the boxes and whiskers in a boxplot?
What are the boxes and whiskers in a boxplot? We use boxplots to show the distribution of data mainly through four quartiles (Q1, Q2, Q3, Q4). The boxplot has two whiskers (Q1, Q4), two smaller boxes (Q2, Q3) and a larger central box (Q2, Median, Q3) ...recode()
The recode() function can be used to rename any of the values of a variable. Example: # recode the variable `Year` and save it is a new column in the data frame Fingers$Year_recode <- recode(Fingers$Year, "1" = "First", "2" = "Second", "3" = "Third", ...Using the R Sandbox
The R Sandbox The R Sandbox is a separate R window you can use to experiment with R code and play around with ideas from the course. It comes pre-loaded with the base R packages and all of the packages and datasets we reference in the textbook. ...